
Palermo Lab

At PalermoLab, my research focuses on developing and applying advanced classical and quantum mechanical molecular dynamics (MD) simulations to investigate the conformational dynamics and molecular mechanisms of CRISPR Cas systems.
Additionally, we explore the use of artificial intelligence algorithms and frameworks for advancing molecular dynamics simulations and exploring rare-event conformational space.
By employing these computational techniques, I aim to gain a fundamental understanding of DNA/RNA molecular systems and gene editors, ultimately providing mechanistic insights that complement and guide rational experimental design.
Sode Lab


Previously, in my master’s program at California State University, Los Angeles, I worked in the laboratory of Dr. Olaseni Sode. My master’s thesis characterized weakly attracted van der Waals (vdW) complexes of Rg-CO2 (Rg = He, Ne, Kr, Xe) using quantum chemistry software and machine learning.
This project culminated in my first first-author publication in 2024: Rodriguez, L.; Natalizio, M.; Sode, O. Theoretical Insights into the Vibrational Structure of Carbon Dioxide Rare-Gas Complexes. J. Phys. Chem. A 2024, 128 (21), 4199-4205. https://doi.org/10.1021/acs.jpca.4c00639.
For a brief explanation of the fundamentals and motivation for this research, read my research update from March 2022.
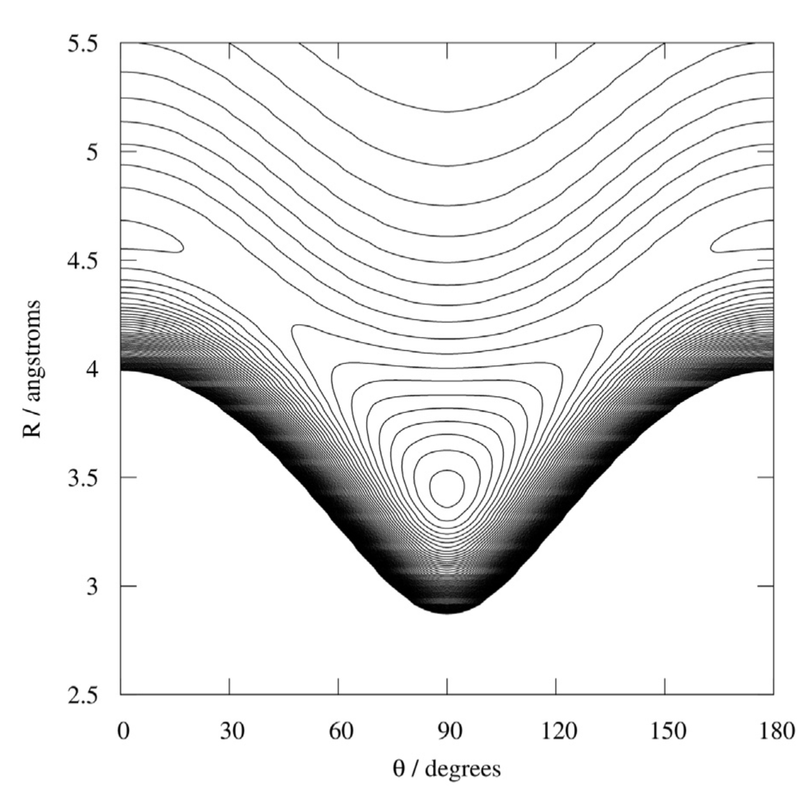
In short, to characterize these weakly interacting complexes we use their vibrational structures. To do this, we constructed a potential energy surface for each complex. In the potential energy surface of Rg-CO$_2$, there are three variables that change the shape of the surface: the intermolecular distance, the angle that the carbon dioxide takes relative to the rare-gas atom, and the energy.
The Sode lab has previously published the potential energy surface of the Ar-CO$_2$ complex using a contour plot. On this plot, the z-axis is depicted in the contours like a contour map. The closer the lines are to each other in a contour plot, the steeper the region is on the plot.
Poster presentations
To see the full posters hosted by Google, click on the corresponding image.
For a comprehensive summary of my research roles, projects, and awards, see my Curriculum vitae or my ORCiD profile.