
Current Activity:
Mar-27-2022:
I'm currently working on investigating the vibrational frequencies of Kr-CO2 and Ne-CO2 vibrational frequency van der Waals complexes. An additional project I will be working on soon is building a machine learning model to predict vibrational frequencies given a configuration of a Ar-CO2 complex using an neural network built through Tensorflow. This will be using the supplemental information repository from a previously published paper from the Sode Lab. You can find it at: SI_CO2Ar
Why this research is important:
We begin our story with the Keeling curve which shows the increasing emissions of CO2 over time. This graph is correlated to the global trend of rising average temperatures. The keeling curve is composed of a few parts. First we see that there is a small sinusoidal pattern in the fine detail of the curve this wave pattern is due to the season variation, when the leaves bloom and die as the temperature changes over the four seasons: winter, spring, summer, fall. We see although there is a seasonal variation accounting for some wave pattern the overall trend of the curve is moving upward as we move from 1960 to 2020.
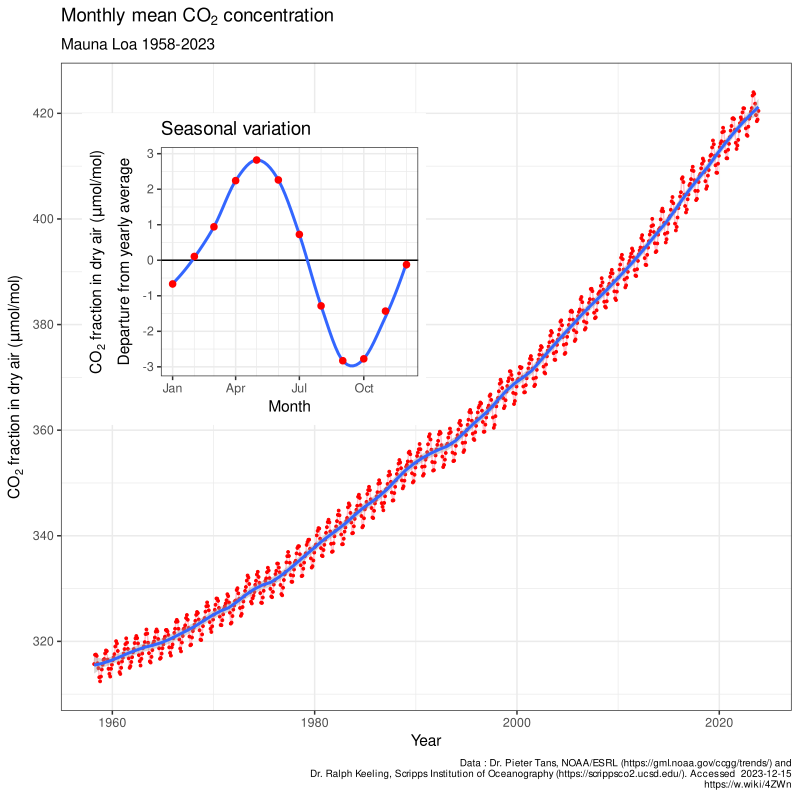
Fig. 1: Keeling curve data from Dr. Pieter Tans, NOAA/ESRL and Dr. Ralph Keeling, Scripps Institution of Oceanography. We see that there is a wave pattern in the fine detail of the graph due to season variation of consumption of carbon dioxide in plants but in general the trend is moving upwards as indicated by the thick blue line in the center of the increasing sinusoidal wave function.
Why Carbon Dioxide is Such a Big Deal:
Well, it has to do with the absorption of energy of CO2. Carbon dioxide is an excellent absorber of energy. Sunlight, therefore, being a source of energy is absorbed by carbon dioxide and produces what is known as the greenhouse effect [2].
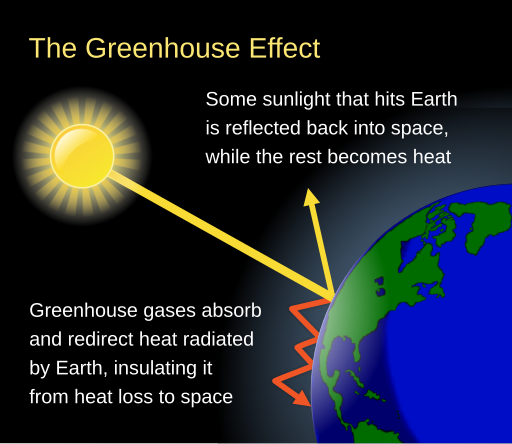
Fig. 1a: A simple diagram explaining the greenhouse effect. This comes from a greater topic on earths energy budget model where certain attributes of the earth such as the surface of the earth, the clouds and atmosphere are partially reflected back from the earth and some of that energy is absorbed by the earth in the form of heat. Of course, there is also some heat generated by the earth itself as well. Check out wikipedias article on Earths energy budget
Sunlight in itself is not a simple signal in the electromagnetic spectrum. Visible light is between 400nm and 700nm.However, being a black body radiator, the suns irradiance to the earth is given through many regions of the electromagentic spectrum. The figure below shows some of the notable regions of the electromagnetic spectrum that solar irradiance goes through and is absorbed by.

Fig 1b: Sunlight has a diverse electromagentic spectrum. In this image we see wavelength on the x axis and solar irradiance in the y axis. A black line outlines a typical 5525K blackbody radiation while the yellow area shows the unabsorped solar irridiance with the orange area showing all of the unabsorbed sunlight at sea level. The blue text shows the wavelength regions in the electromagnetic spectrum where the sunlight is absorbed. Note the declining peaks of the orange area where the absorption of sunlight has taken place due to oxygen, water, and carbon dioxide.
Where Our Research Fits In:
Our study comes into play when we discuss the absorption of energy in CO2. According to Fomichev and co-workers, carbon dioxide absorbs sunlight (solar energy) in the near infrared region of the electromagnetic spectrum causing the molecule to excite into the anti-symmetric vibrational frequency mode. Vibrational spectroscopists know this as the $\nu_3$ normal mode of CO2.

Fig. 1c: The absorption frequency of water vapor and greenhouse gases. The X axis is shown in $\mu$m from 1$\mu$m to 30$\mu$m which is $1 \cdot 10^3$nm to $3 \cdot 10^4$nm or the same as $1\cdot 10^7$cm-1 to $3.33\cdot10^2$cm-1 or $1\cdot 10^4$ to $1\cdot 10^5$ angstroms. The graph depicts a high absorption for CO2 between 833cm-1 and 500cm-1 which is the mid infrared to far infrared region of the electromagnetic spectrum.
Robert Rohde and NASA Earth Observatory show in figure 1c above that the absorption of carbon dioxide happens at the mid to far infrared regions of the electromagnetic spectrum. Spectroscopists define this through spectrometers.[8] They explain that water vapor also absorbs in certain wavelengths but that there is a gap in that water absorption where water vapor does not absorb energy. It is this place that is known as the 'water vapor window' where the energy emitted by earth and the sun would escape into space. Carbon Dioxide's absorption wavelength are in this region causing what NASA Earth Observatory states is a 'closing' of the water vapor window. The absorption of these wavelengths of energy cause carbon dioxide to enter its excited vibrational modes.

Fig. 2: Here we see a digram depicting the excitation of molecules in food by a conventional cooking microwave. Food in a microwave is heated through the rotations and vibrations of water molecules via a standing microwave, the turning plate upon which the food plate rests is rotated through this rotating microwave standing wave field cooking the food more evenly. Figure By: P. J. Annis et al. 1980.
Think of vibrational frequencies and vibrating molecules kind of like how food is cooked in a microwave, we cook the food using a microwave signal generated by the microwaves magnetron causing the rotation and vibration of the molecules of water in your food [3][4]. This same effect is happening with the solar radiation from the sun hitting the carbon dioxide molecules in the atmosphere.

Fig. 3: This gif animation shows the $\nu_2$ degenerate bending mode of CO2. There are four normal modes of vibration in CO2. Two of those modes have the same energy which is known as the $\nu_2$ mode. You can see these two degenerate bending modes depicted in figure 4 where the two modes become distinct in energy when a third molecule is introduced to the system via a van der Waals bond. By: Me. Using Gaussian 09.
The work of the Sode Lab is the explain these vibrational excitations known as vibrational frequencies using computational theoretical chemistry and machine learning in van der Waals Complexes. In studying the van der Waals complexes we can study the vibrations of the carbon dioxide molecule and the impact that outside atoms and molecules affect its vibrational frequency.
Currently, we are using Rg-CO2 complexes (Rg = He, Ne, Ar, Xe) to build potential energy surfaces using vibrational frequencies to investigate the nature of the weak molecular bonds, investigate the nature of the vibrational frequencies and their attribution to the chemical nature of the van der Waals complexes. A visual example of one of our van der Waals complexes along with its associated potential energy surface is shown on the slide in figure 5 below.
For a look at what the vibrational frequencies of our complex, we take a look at figure 4 below from Sharpe and co workers in 1991. According Richard Jones at University of Texas at Austin, the normal modes of vibration of a non-linear molecule are determined by the formula $ 3n - 6 $ where $n$ is the number of atoms. Therefore, for the t-shaped Rg-CO2 there are six normal modes of vibration. These six modes have been classified by convention by Sharpe and co workers in figure 4 from their 1991 publication.[5]

Fig. 4: The fundamental excited vibrational states of a molecule are known as its normal modes. Here Sharpe and coworkers show the 4 normal modes of vibration for the CO2 molecule. Here we can see that the degeneracy of the CO2 $\nu_2$ mode has been interrupted exists as two discrete normal modes of vibration each with their own discrete energy value. This is known as splitting in the vibrational frequencies.
Once the potential energy surfaces are created just like in figure 5 below we can begin to comment on the individual attributes of the van der Waals complex. The potential energy surface (PES) is a three dimensional object that encapsulates the bond distance and angle's contribution to the energy of the complex. In the case of water, shown in figure 4 below, we can see that there are some high and low points in the surface. These low points are called the minima and is where the chemistry happens for the molecular system. In the Sode Lab research, we developed a machine learning process and workflow to create potential energy surfaces for the prediction of energy given configurations of the van der Waals (vdW) complexes.
Fig. 5: This is the potential energy surface of water. In this example image, you can see that a potential energy surface is a three dimensional object that has two inputs for one output. The bond angle and the bond length in the x and y directions give rise to the energy in the z dimension's output.
Now that we have developed our potential energy surface, we can comment on the chemical and physical properties of the van der Waals complexes and comment on intermolecular interactions that affect the carbon dioxide molecule. The graphical plot that is in the paper shows the two input axes along with a contour mapping of the energy for the given two inputs. The x axis being the angle of the intermolecular vdW bond and the y axis being the distance (in angstroms) of the intermolecular vdW bond. The lowest point is the global minima shown in the middle of the saddle and another local minima point at the ends of the contour map. We take into consideration that the graph is wrapped around meaning that the 0 degrees point is the same as the 180 degrees point on the x axis.

Fig. 6: This is the potential energy surface of the Ar-CO2 van der Waals complex published in 2021 by the Sode Lab. Here we see that there exists two isomers for the structure of the van der Waals complex, one T-shaped and one linear or 'L-shaped'. By: O. Sode et al. 2021.
Recall that there are higher and lower energy vibrational states of carbon dioxide and that sunlight causes an excitation into one those vibrational states (The $\nu_3$ mode) and back down to the $\nu_2$ mode. When the van der Waals complex is formed there is a splitting of the energy of the two bending modes of CO2. With this information we can see that we can investigate more deeply into the vibrational excitations of CO2 and elucidate the nature of the splitting of the bending modes. Perhaps we might be able to control the excitation of CO2 using other gases in order to dampen these excitations. Through investigating the vdW complexes we can show how other molecules interact with the CO2 molecule and since the vdW bond is a weak bond that is formed through temporary dipole moments there wouldn’t be much barrier in the way of producing out chemical reaction if we can just elucidate further the nature of these weakly bound systems.
References:
[2] V. I. Fomichev et al. Geophys. Lett. 31. 2004
[3] ACS : Microwaves
[4] P. J. Annis. Int. J. Food Prot. 43. 1980.
[5] R. Jones Normal Modes of Vibration. utexas.edu.
[6] S. W. Sharpe et al. J. Chem. Phys. 94. 233. 1991.
Continue the conversation